


Problem: How can organizations monitor threats across their AI tool integrations and respond where needed.
Organizations are integrating more and more AI (MCP) tools in their systems and are lacking a unified interface to track usage and threats which could expose security holes for the organization and their customers.
This was a 0-1 project where I built a dashboard and layout framework we wanted to mirror to other products, as we brought them up to a more unified UI, bringing monitoring to those features, and expand the product scope over time.
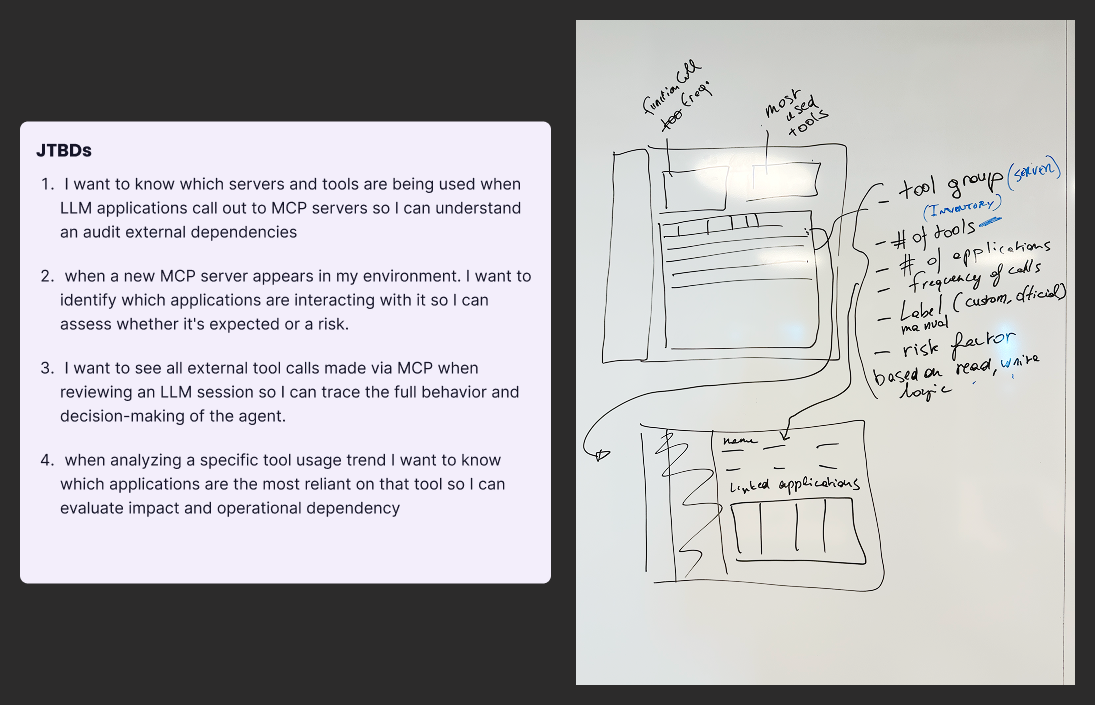
To begin, I worked with my PM and EM to define the JTBDs and laying out the interactions and data with rough whiteboard investigations.
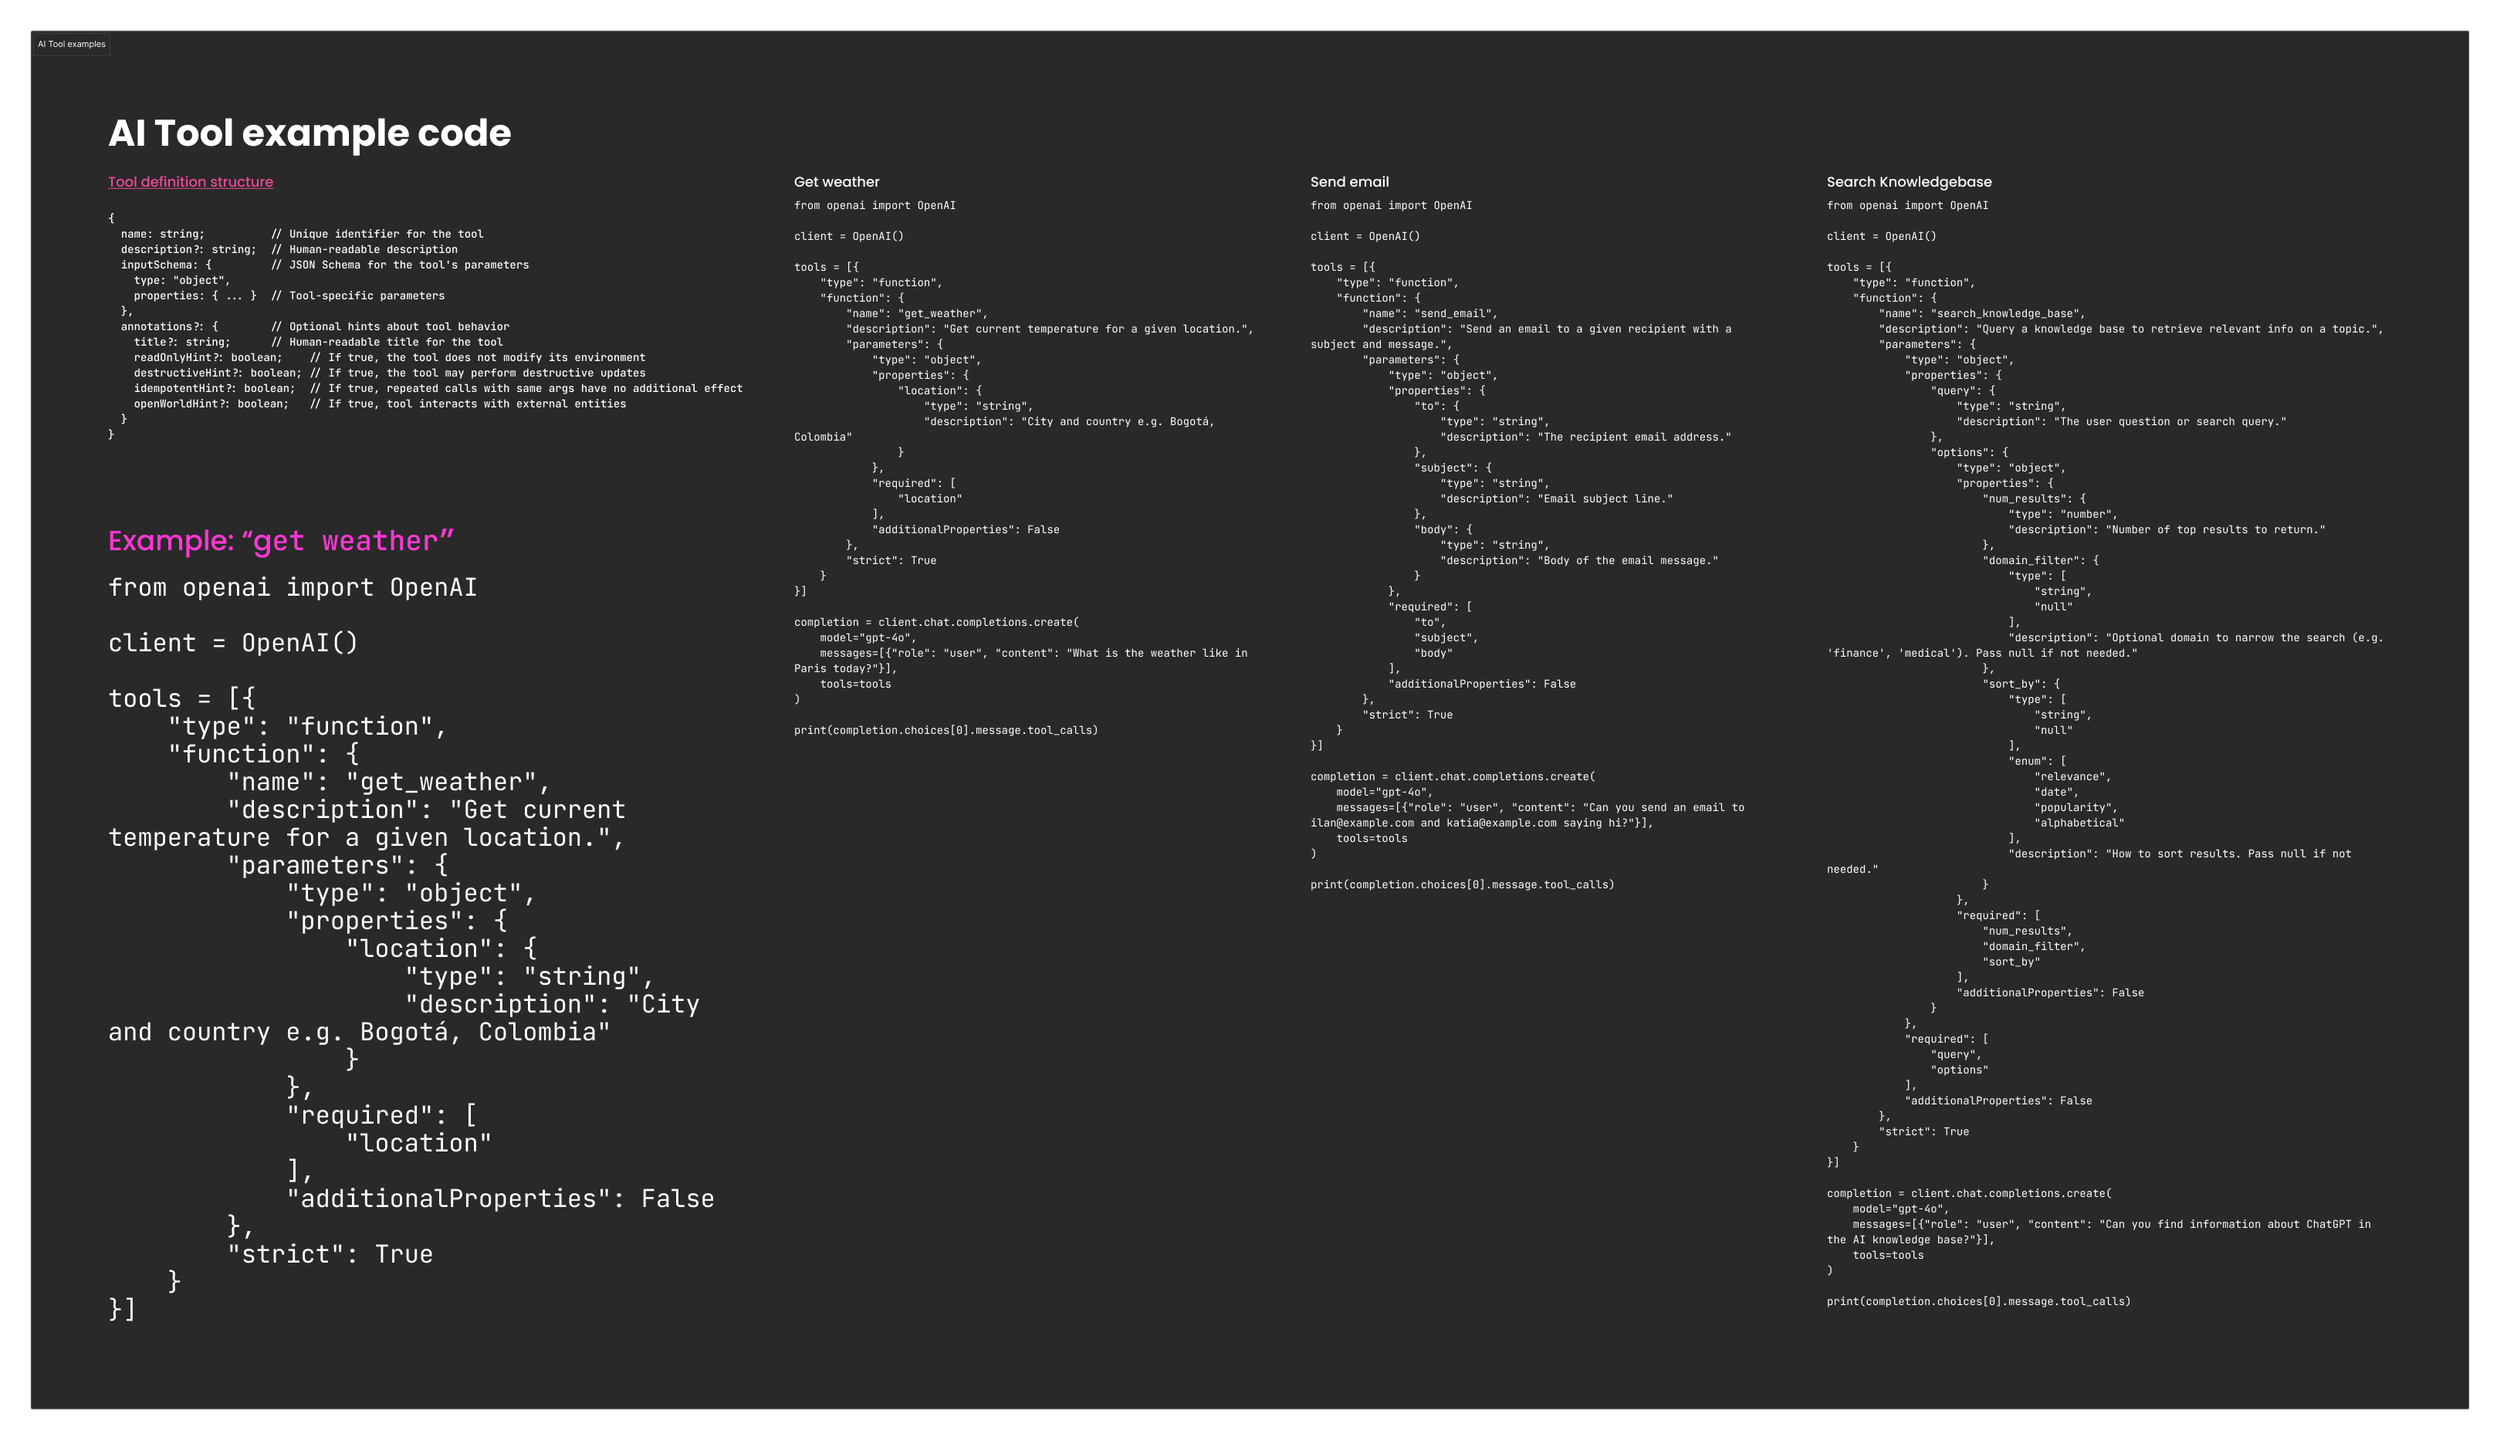
I also investigated various AI tool documentation to understand data points in order to build a structure for data monitoring. One issue we encountered is that AI tools do not have any meaningful standardized datapoints, so I opted to keep monitoring to more surface level metadata in order to launch the product. We would expand on the data monitoring depth as we iterated in the future.
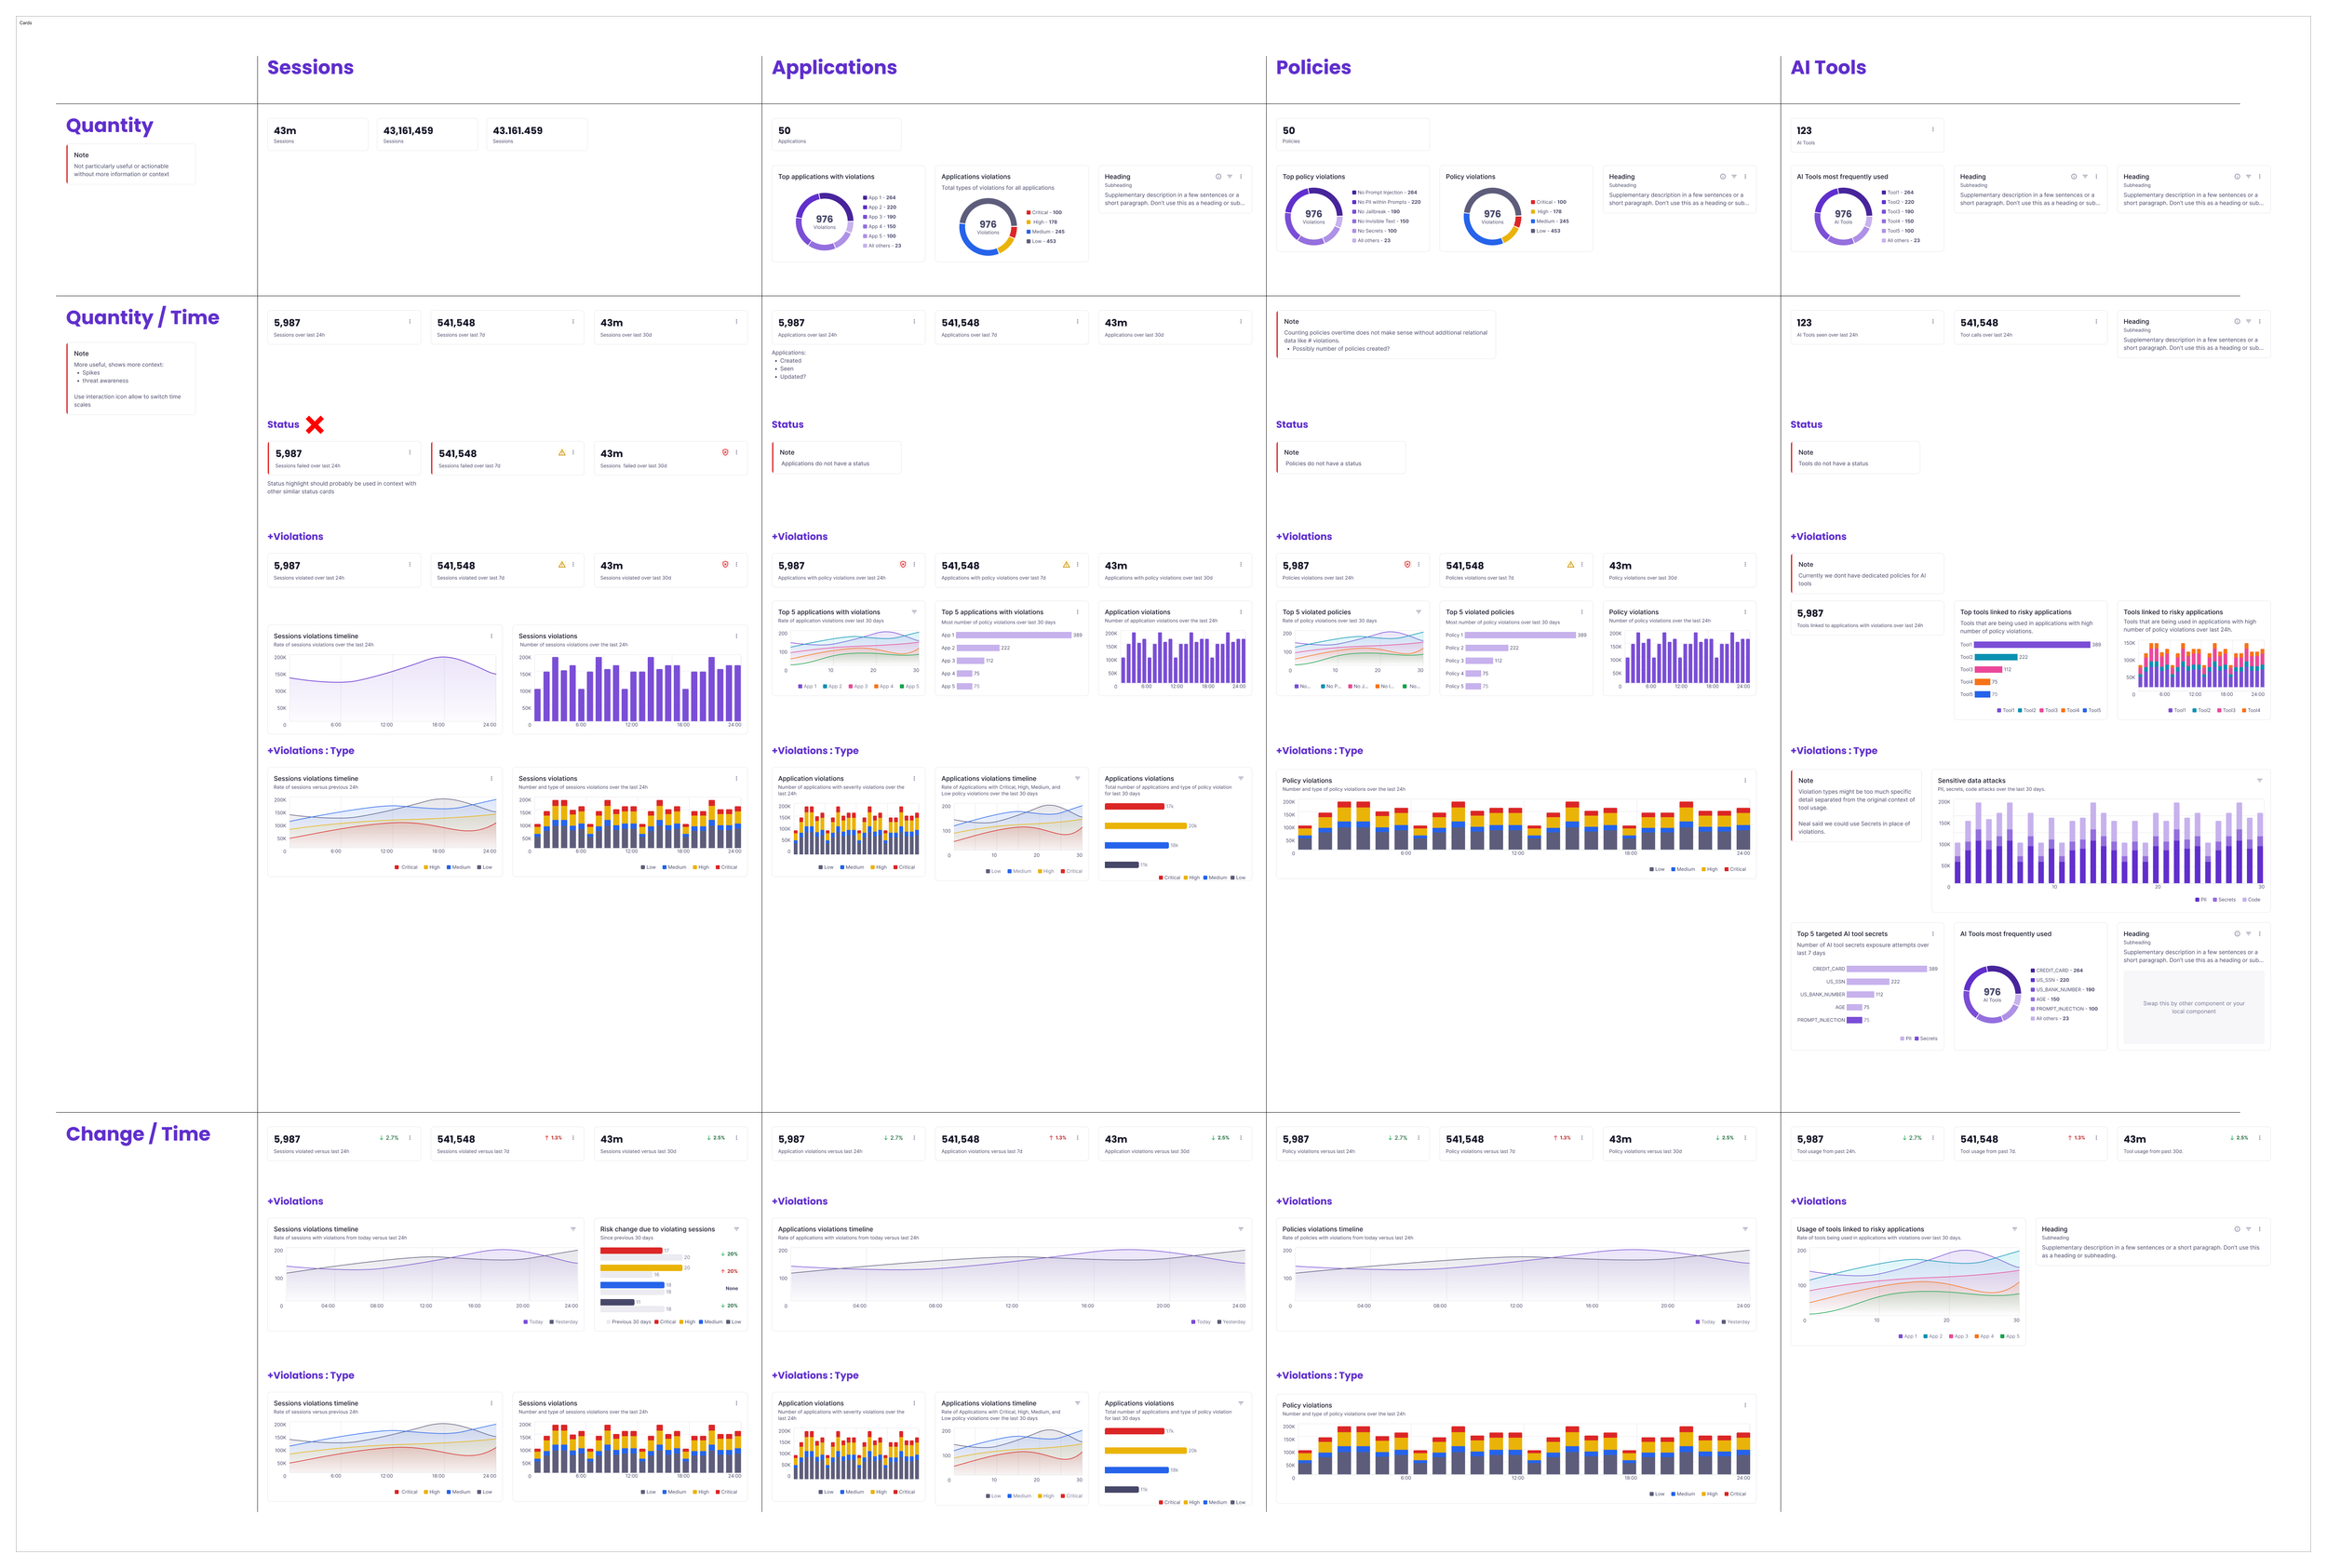
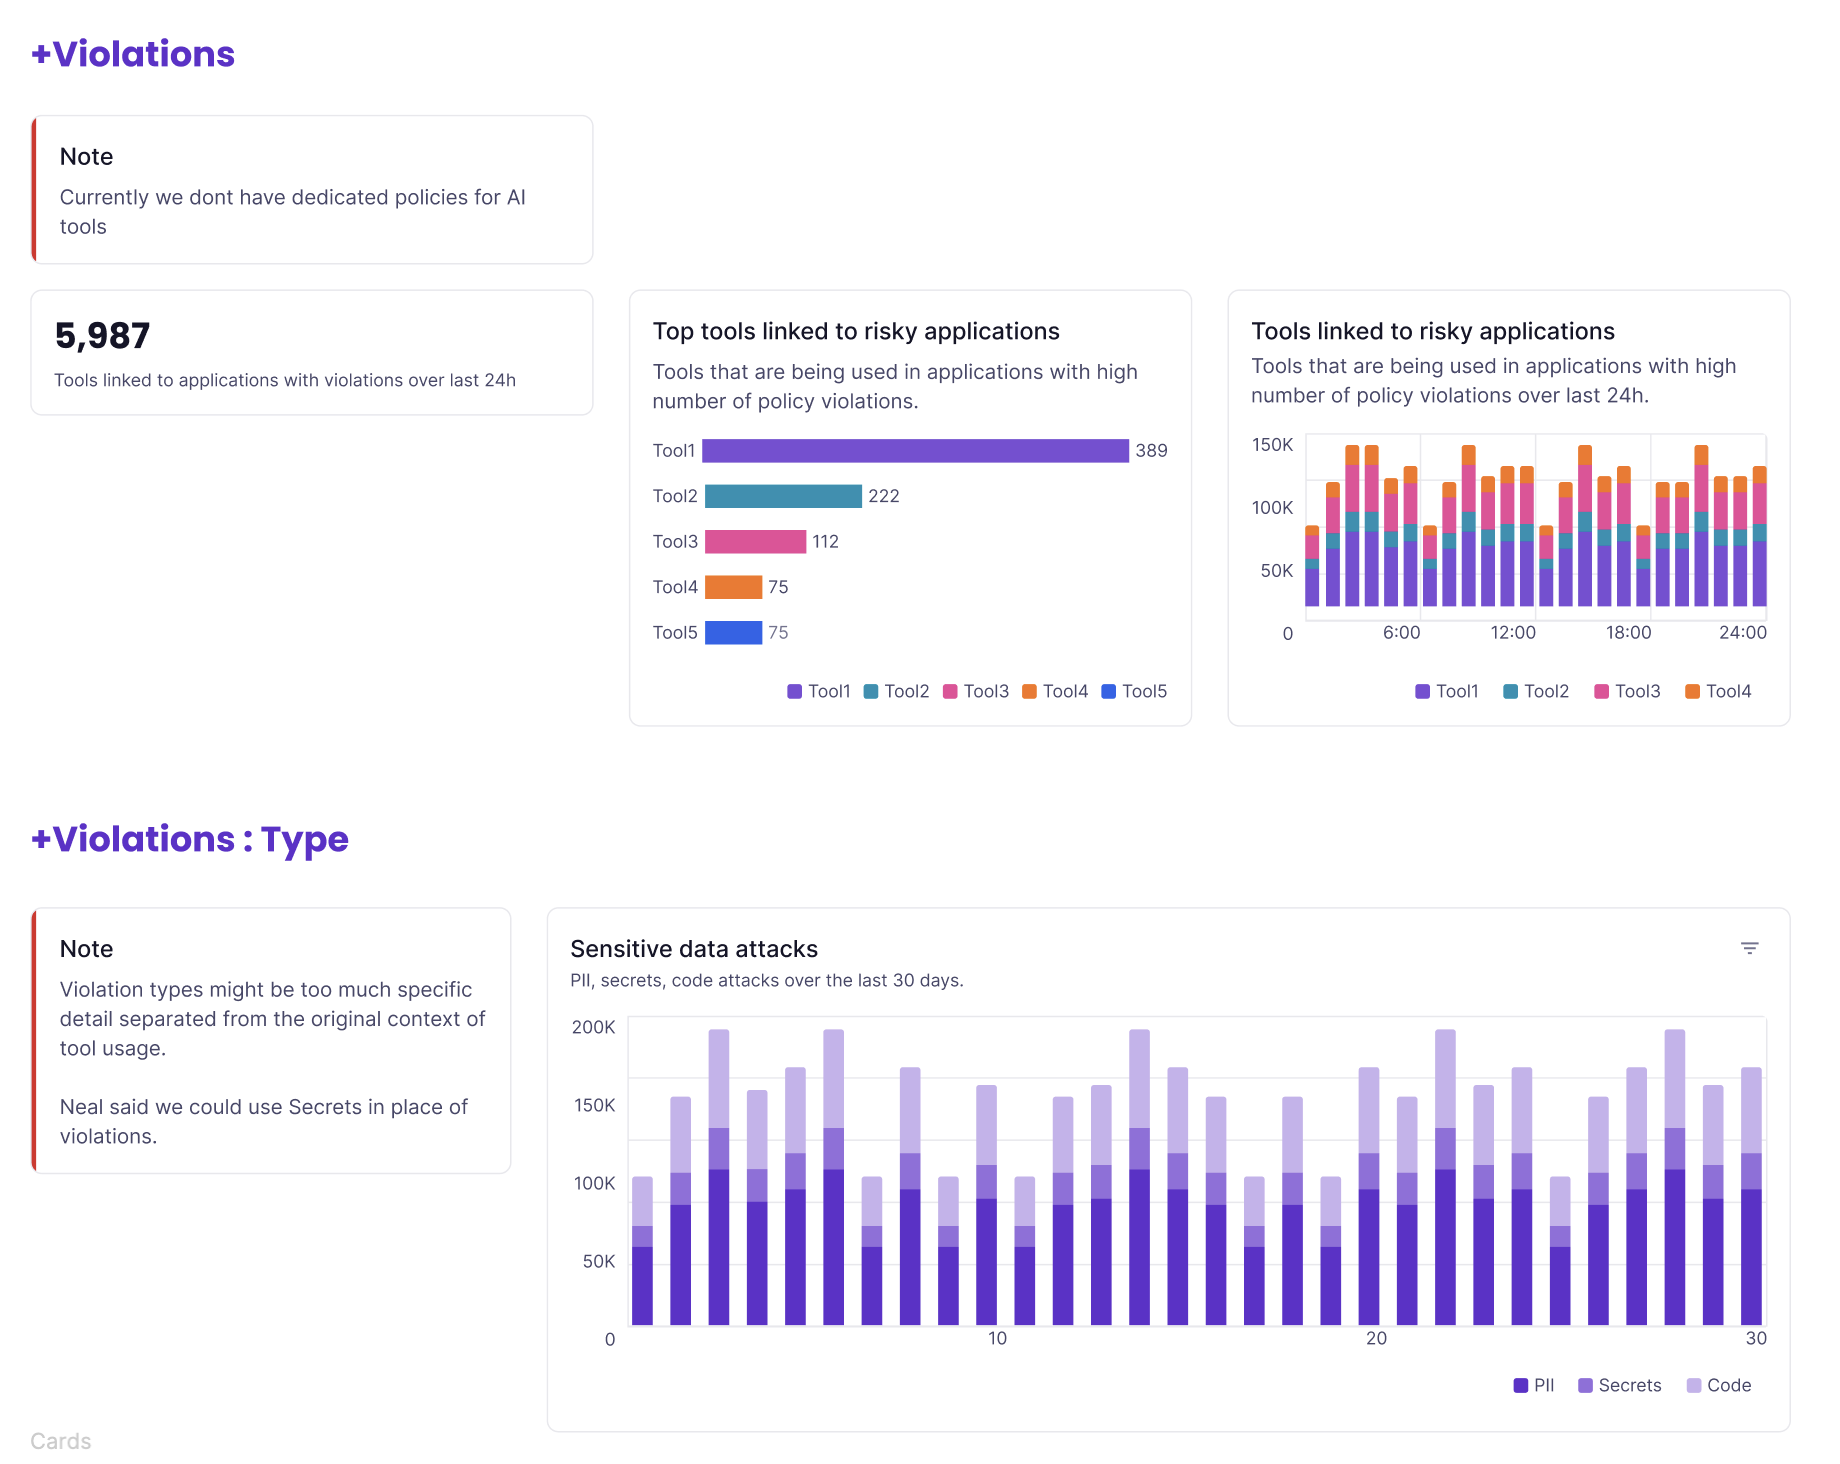
As I built out a framework for page content I would also iterate on data visualizations. This was a way to build more robust data visual card components which required updates to the design system as we were linking new observable datapoints in the backend for threat monitoring.
I brought this research to our design system creating new data viz card components to use in context when relevant, allowing other teams to use in their sections.
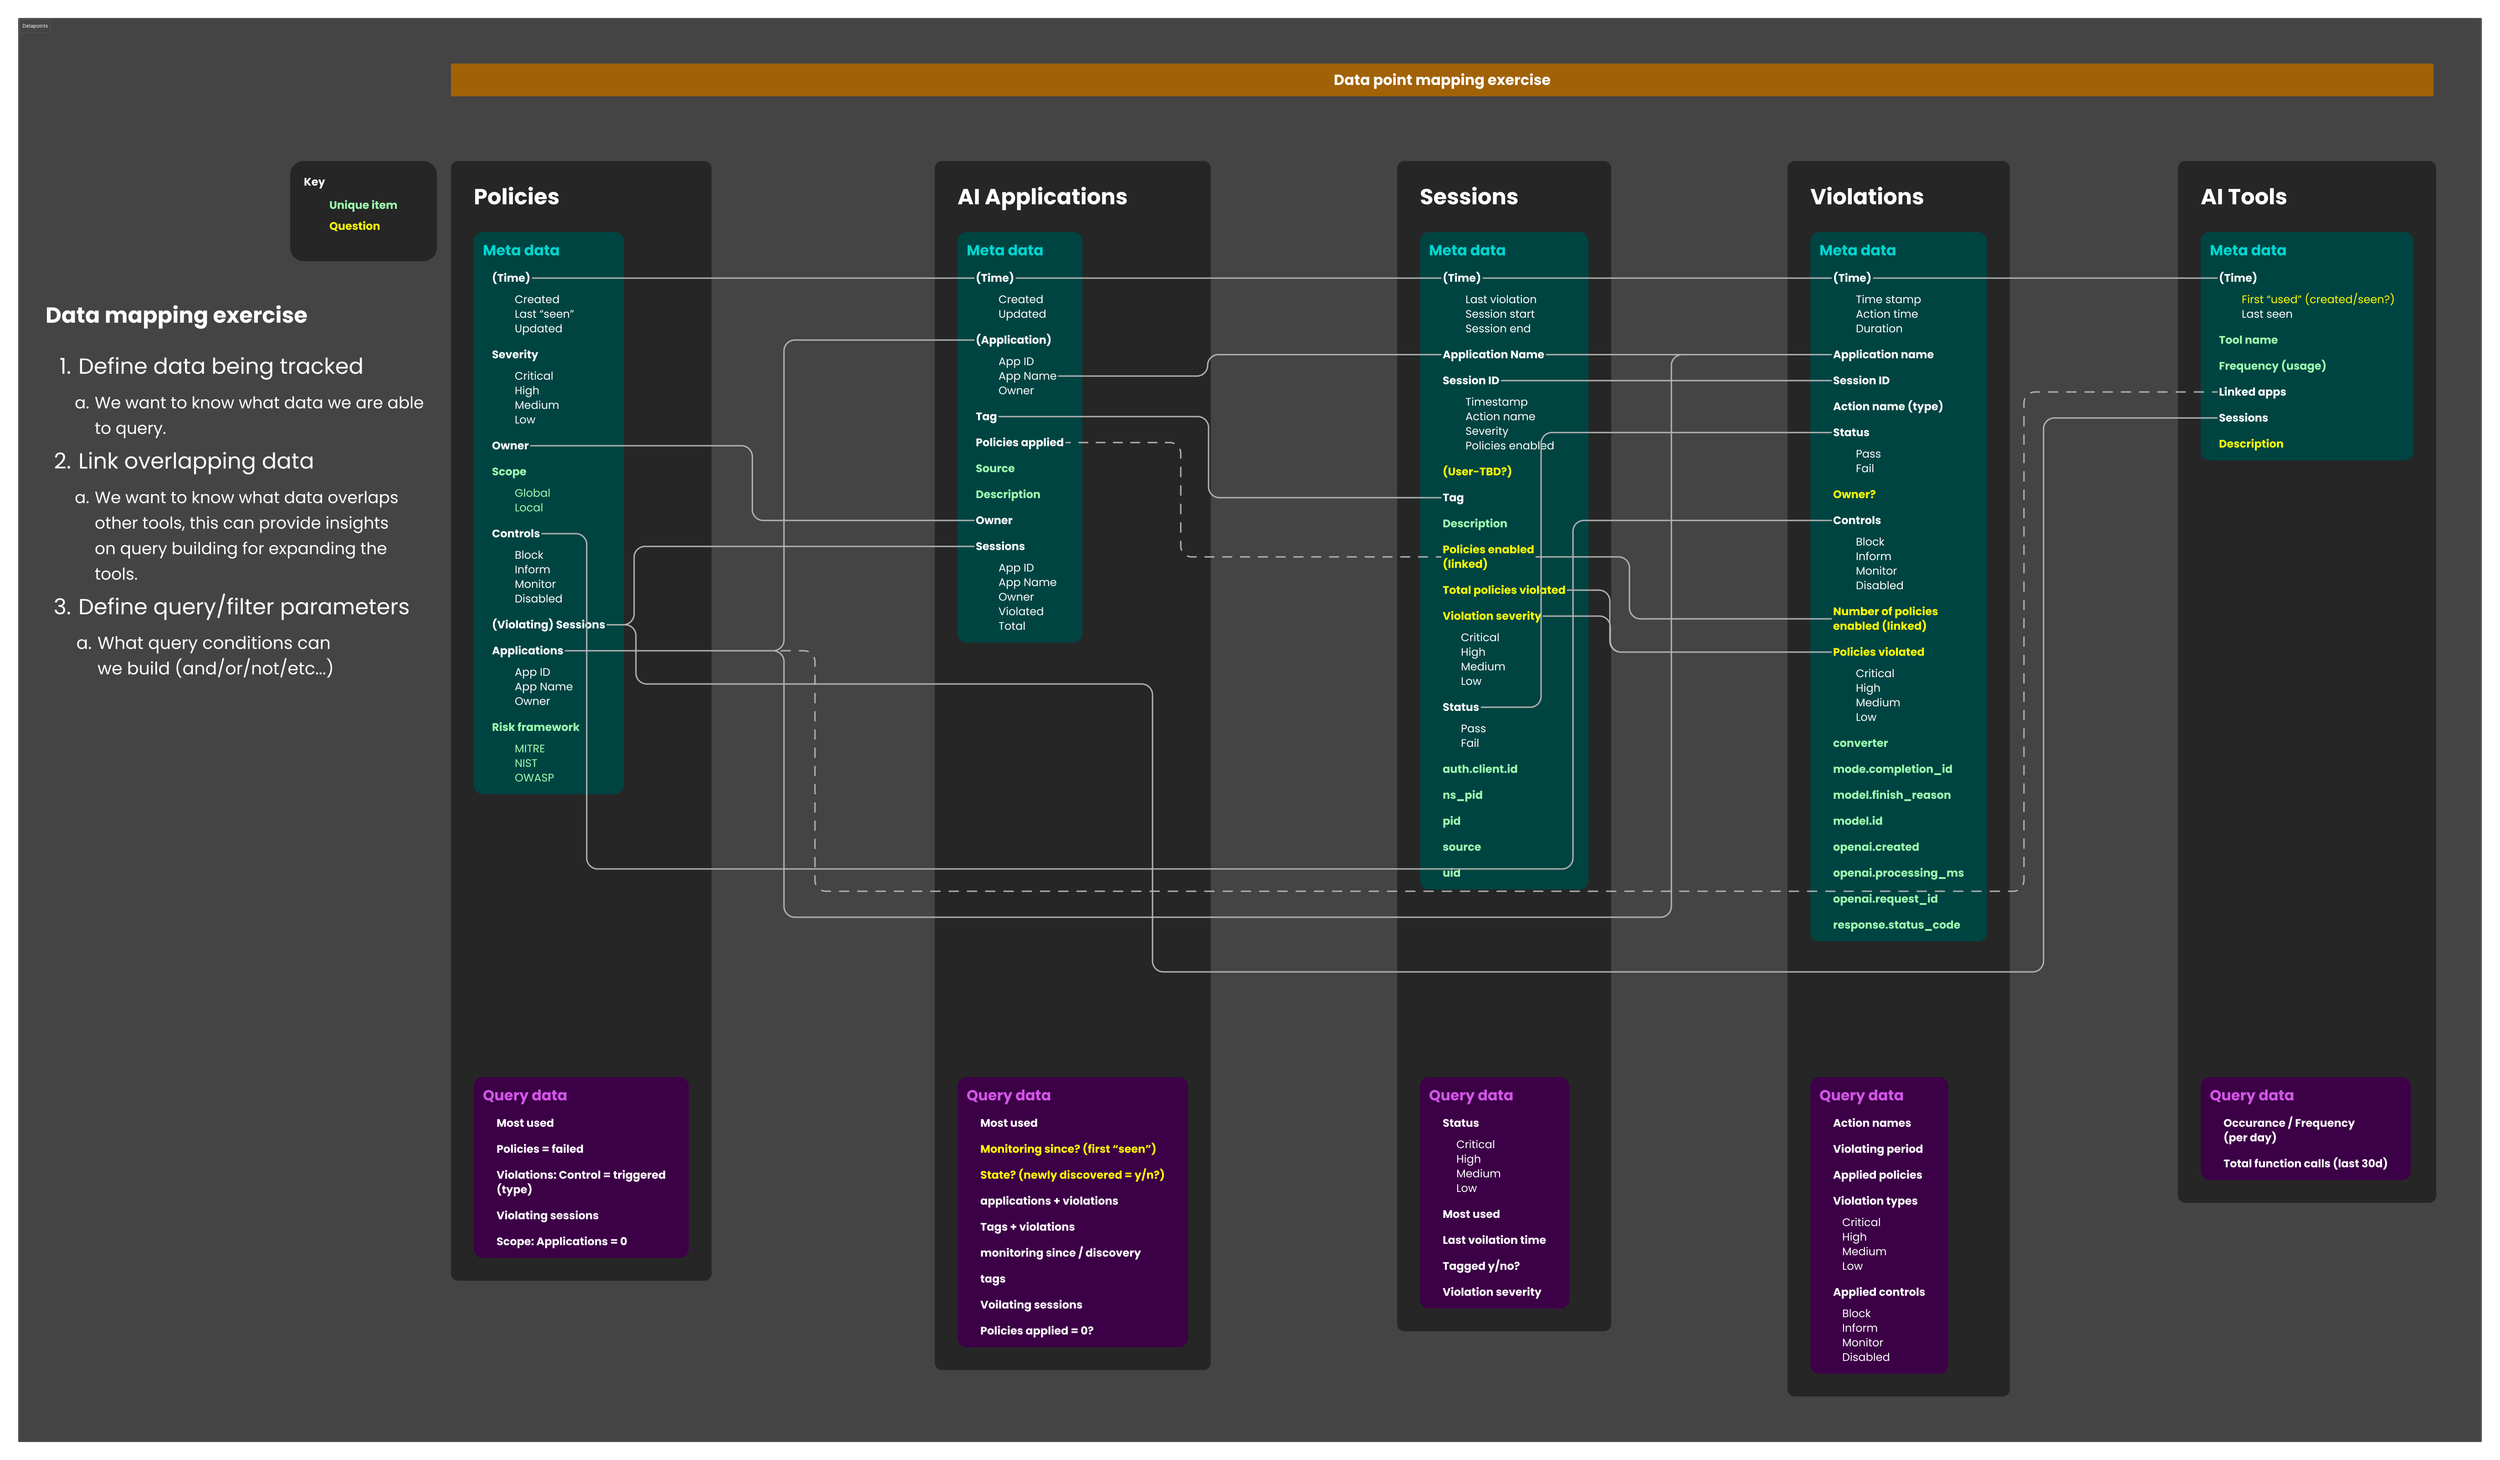
I mapped out our data table over quantitative data we already monitored such as session activity, applications, violations against metrics such as number of occurrences, time, changes over time.
From here I also added these updated components to other sections.
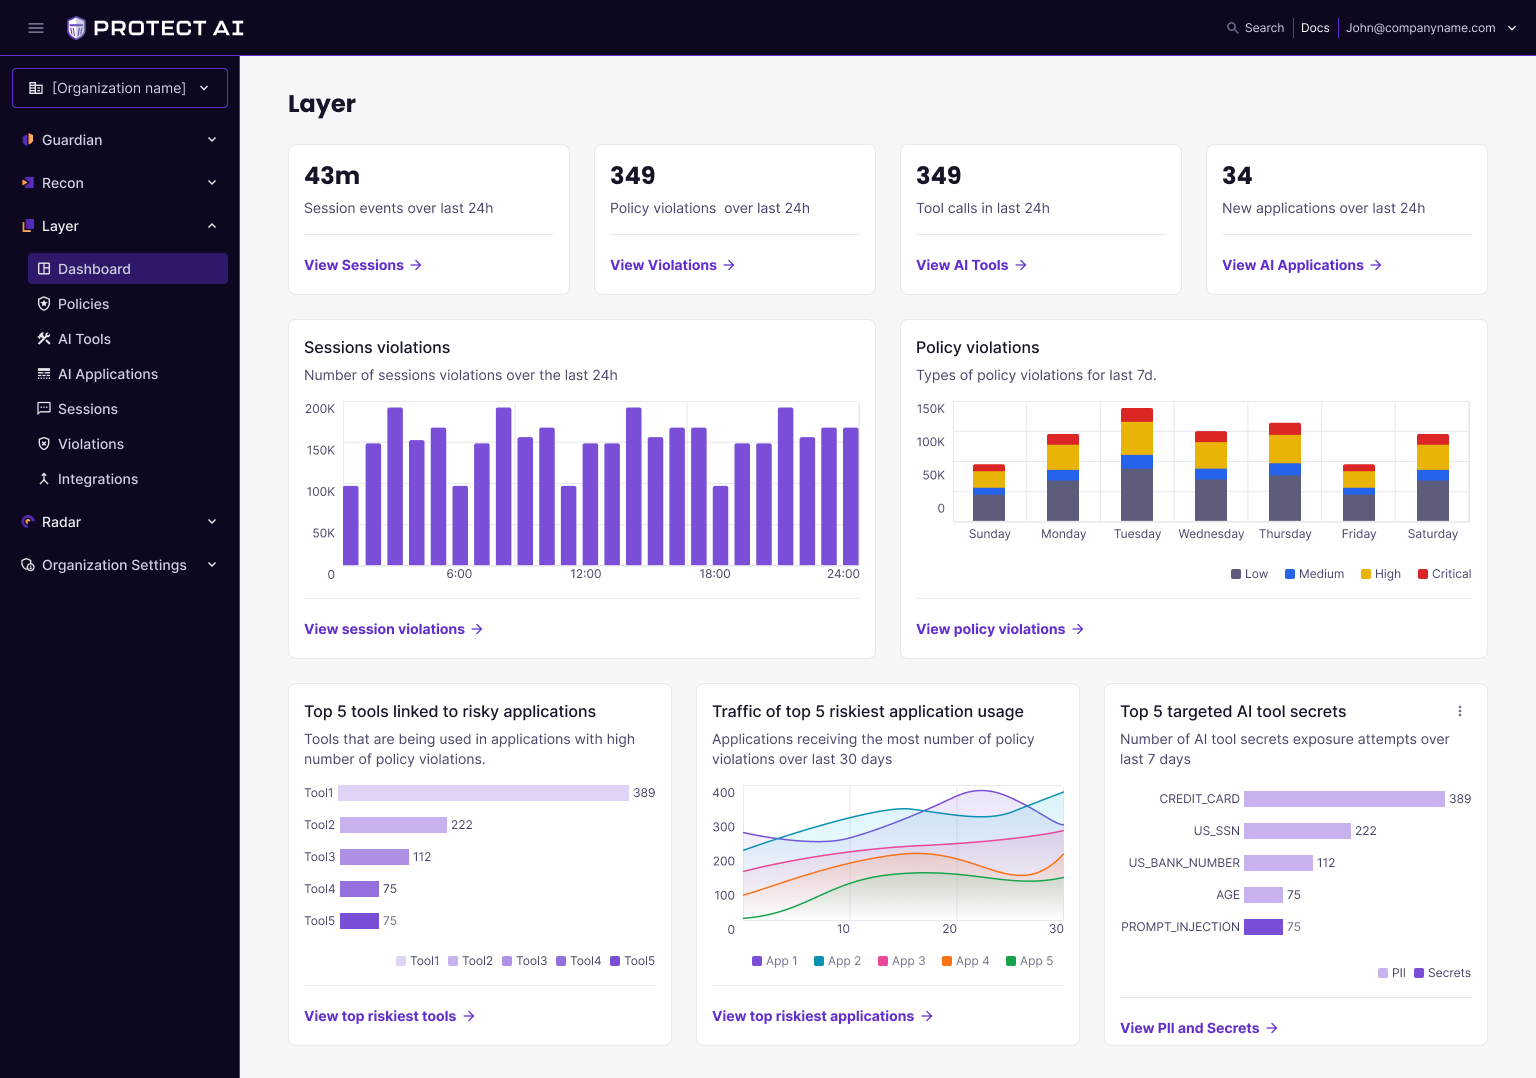
Solution: A new dashboard UI, allowing our customers to have a single point to view broad insights into their AI Tools profile.
In this work effort, I created new data viz components, brought those across the platform to other pages, and was able to deliver the work under tight time constraints due to needing to showcase the work at the RSA conference as part of the company acquisition by Palo Alto Networks.